-de8bd8f33c3e44a59907dafe1884f228.png)


Ceph mgr 内部包含了对接 Prometheus 的监控模块,该模块启用后会监听在每个 mgr 节点的 9283 端口,该端口用于提供一个 HTTP 服务,Prometheus 将通过这个接口采集 Ceph 监控数据。
安装 Prometheus
参考:https://www.zze.xyz/archives/prometheus-1-quick-install.html
启用 Prometheus 模块
执行下面命令来启用名为 prometheus 的模块:
$ ceph mgr module enable prometheus
然后就可以在 mgr 服务所在主机查看到监听的 9283 端口:
$ ss -tnalp | grep 9283
LISTEN   0         5                         *:9283                   *:*        users:(("ceph-mgr",pid=1263,fd=22))
配置 Prometheus
Ceph 集群的监控接口已经提供了,现在要配置 Prometheus 来通过这个接口采集数据,配置如下:
$ vim prometheus.yml
scrape_configs:
  - job_name: 'ceph-cluster'
    metrics_path: /metrics
    scheme: http
    static_configs:
    - targets: ['172.16.16.65:9283']
重启 Prometheus 服务,然后就可以在 Prometheus 的 Web 页面看到 ceph-cluster 这个 target 处于 up 状态,说明数据可以正常采集了。

安装配置 Grafana
安装 Grafana 可以参考:https://www.zze.xyz/archives/prometheus-grafana.html。
进入 Grafana 添加数据源,仅需配置 Prometheus 服务的地址:

应用模板展示数据
Grafana 有一个 dashboard 模板库,而这个模板库中就已经存在了用于渲染 Ceph 监控数据的模板,直达链接:
比较流行的一个 Ceph 监控模板的 ID 是 2842,在 Grafana 中可以直接导入使用它:
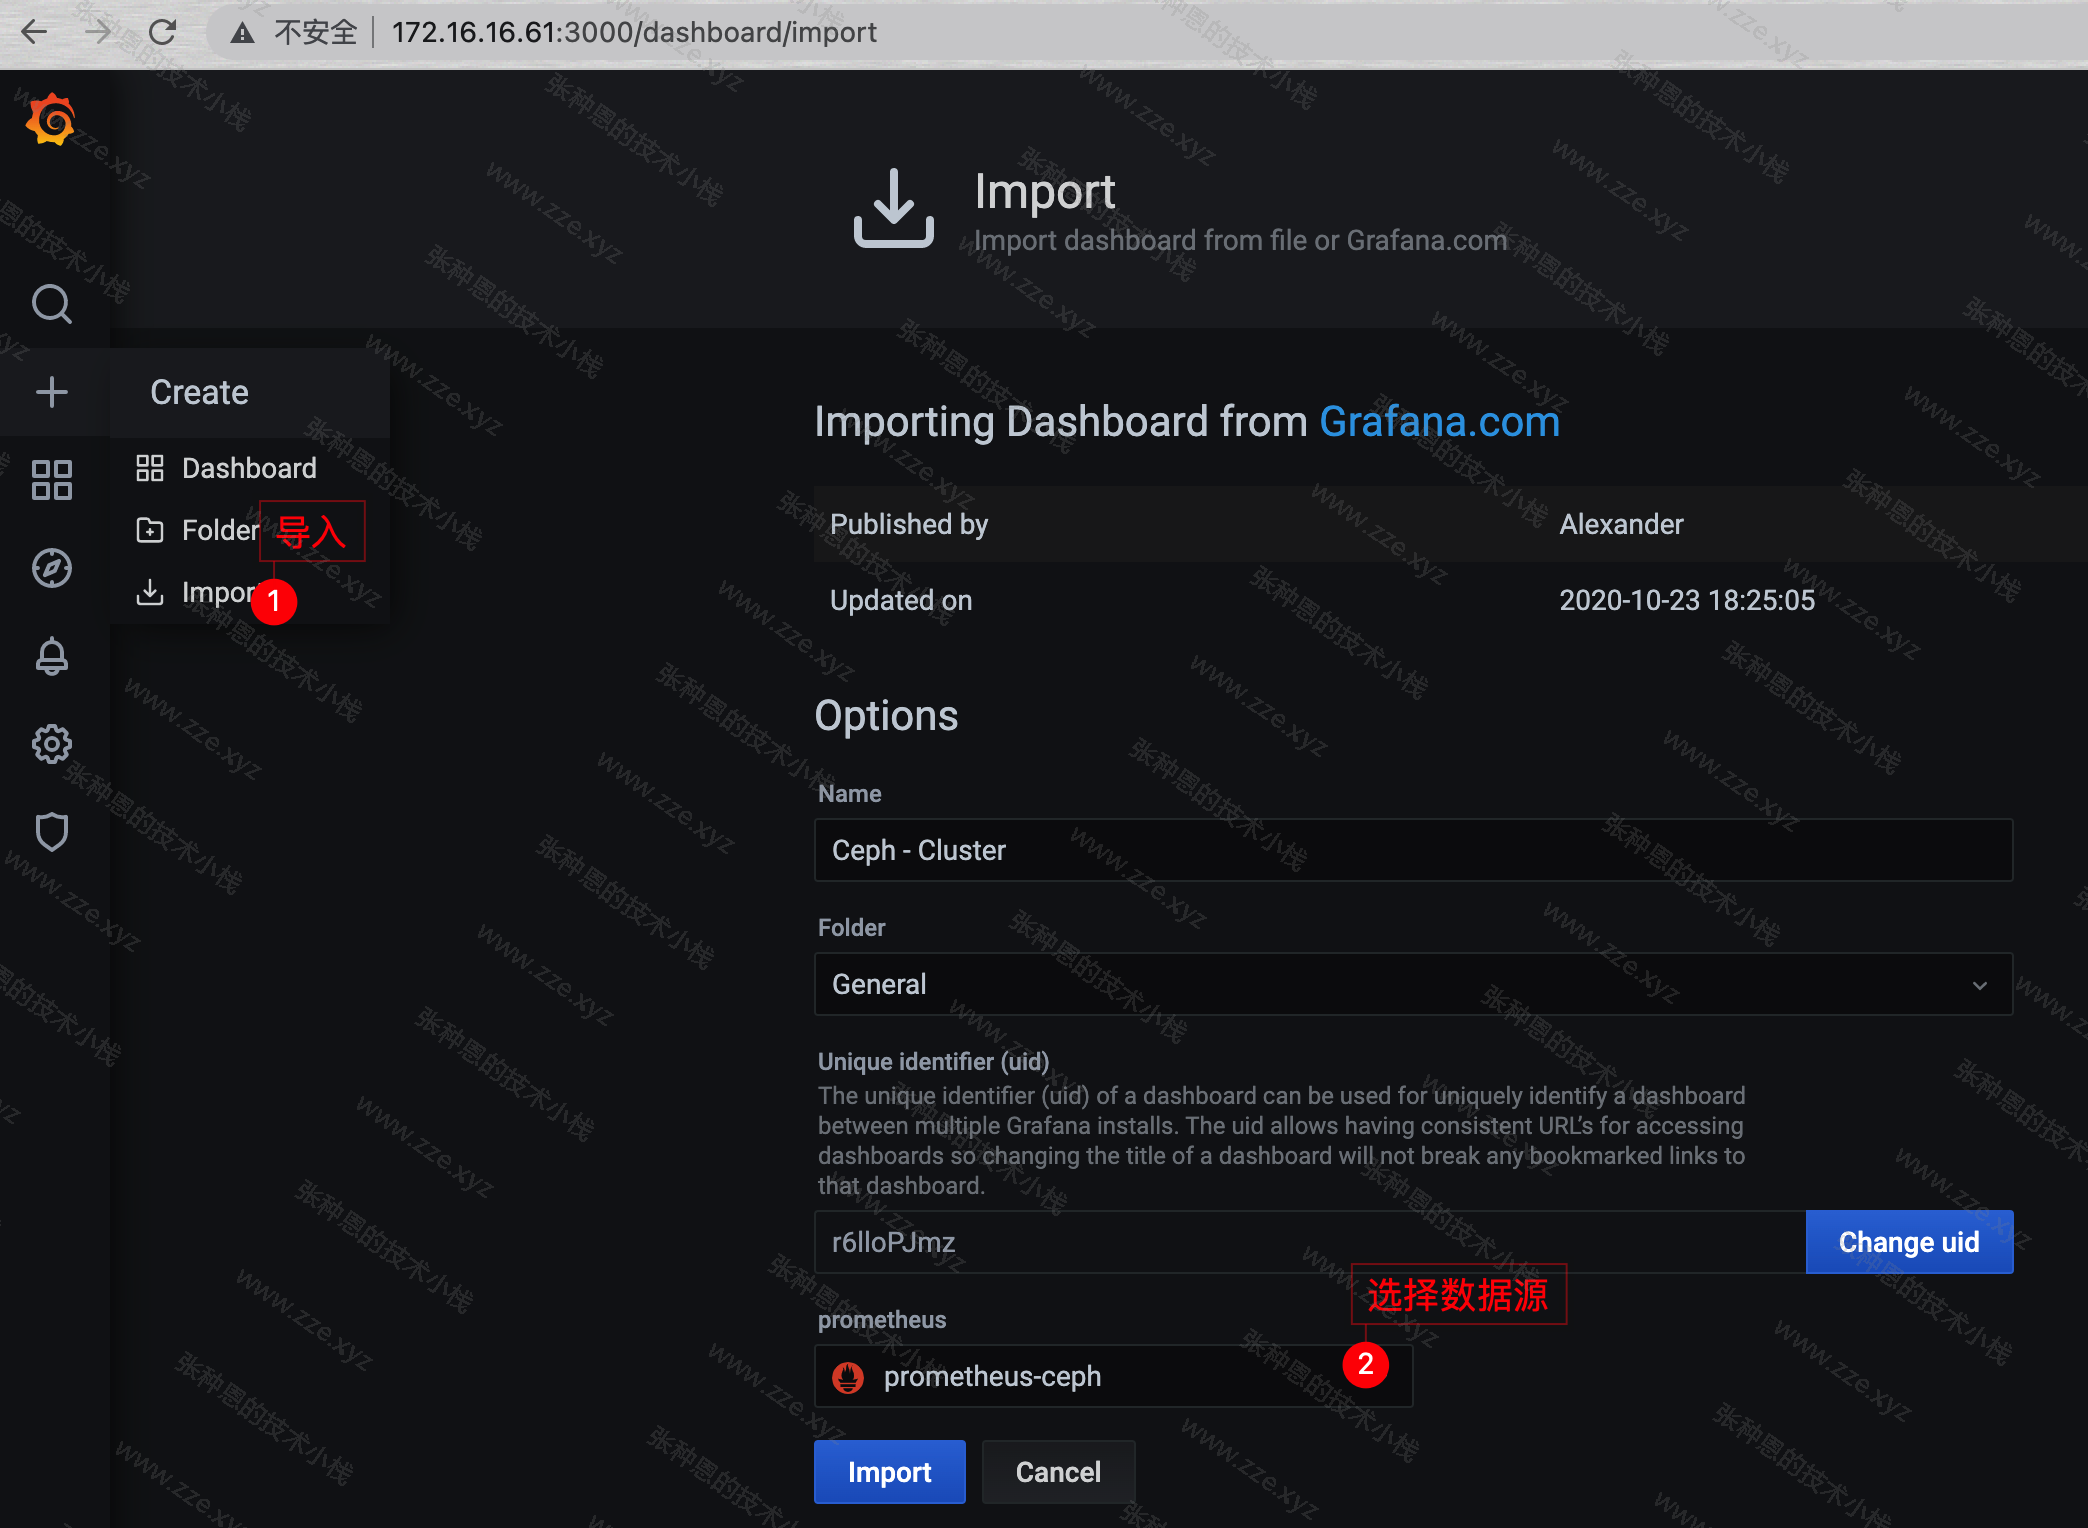
然后我们就可以通过可视化面板的形式清晰地看到 Ceph 集群的状态信息:

还有一个比较常用的用于展示 Ceph 存储池相关信息的模板,它的 ID 是 5342,这里就不做演示啦~
评论区