-de8bd8f33c3e44a59907dafe1884f228.png)


准备
准备如下两台主机:
| 主机 IP | 系统 | 功用 |
|---|---|---|
| 10.0.1.200 | CentOS 7.8 | Prometheus Server(Prometheus 服务) + Grafana + pushgateway |
| 10.0.1.51 | CentOS 7.8 | node_exporter(被监控节点) |
安装 Prometheus 之前,我们需要保证本地主机的时间是同步、准确无误的,这是因为 Prometheus 的 T-S 本地数据库对时间的准确性要求是很高的。
通过下面命令来配置时区和 ntp 定时任务:
$ crontab -e
*/5 * * * * /usr/sbin/ntpdate ntp1.aliyun.com &> /dev/null

$ timedatectl set-timezone Asia/Shanghai
下载 Prometheus 相关安装包:
- Github 下载:https://github.com/prometheus/prometheus/releases
- Prometheus 官网下载:https://prometheus.io/download/
- 百度网盘下载(提取码:
ipp8):https://pan.baidu.com/s/1PsOJL56Sp1XwO815u35NbA
后续使用的所有资源都在此网盘链接中。
Prometheus
部署
1、解压 Prometheus 安装包到指定目录:
# 解压
$ tar xf prometheus-2.19.2.linux-amd64.tar.gz -C /usr/local/
# 创建软链接
$ cd /usr/local/ && ln -s prometheus-2.19.2.linux-amd64 prometheus
2、配置环境变量:
$ echo 'export PATH=$PATH:/usr/local/prometheus/' > /etc/profile.d/prometheus.sh\
$ . /etc/profile.d/prometheus.sh
3、前台启动:
$ cd /usr/local/prometheus/ && ./prometheus
level=info ts=2020-06-28T16:08:25.315Z caller=main.go:302 msg="No time or size retention was set so using the default time retention" duration=15d
level=info ts=2020-06-28T16:08:25.315Z caller=main.go:337 msg="Starting Prometheus" version="(version=2.19.2, branch=HEAD, revision=c448ada63d83002e9c1d2c9f84e09f55a61f0ff7)"
level=info ts=2020-06-28T16:08:25.315Z caller=main.go:338 build_context="(go=go1.14.4, user=root@dd72efe1549d, date=20200626-09:02:20)"
level=info ts=2020-06-28T16:08:25.315Z caller=main.go:339 host_details="(Linux 3.10.0-1127.el7.x86_64 #1 SMP Tue Mar 31 23:36:51 UTC 2020 x86_64 test-01 (none))"
level=info ts=2020-06-28T16:08:25.315Z caller=main.go:340 fd_limits="(soft=65535, hard=65535)"
level=info ts=2020-06-28T16:08:25.315Z caller=main.go:341 vm_limits="(soft=unlimited, hard=unlimited)"
level=info ts=2020-06-28T16:08:25.330Z caller=main.go:678 msg="Starting TSDB ..."
level=info ts=2020-06-28T16:08:25.353Z caller=web.go:524 component=web msg="Start listening for connections" address=0.0.0.0:9090
level=info ts=2020-06-28T16:08:25.354Z caller=head.go:645 component=tsdb msg="Replaying WAL and on-disk memory mappable chunks if any, this may take a while"
level=info ts=2020-06-28T16:08:25.354Z caller=head.go:706 component=tsdb msg="WAL segment loaded" segment=0 maxSegment=0
level=info ts=2020-06-28T16:08:25.354Z caller=head.go:709 component=tsdb msg="WAL replay completed" duration=276.324µs
level=info ts=2020-06-28T16:08:25.356Z caller=main.go:694 fs_type=XFS_SUPER_MAGIC
level=info ts=2020-06-28T16:08:25.356Z caller=main.go:695 msg="TSDB started"
level=info ts=2020-06-28T16:08:25.356Z caller=main.go:799 msg="Loading configuration file" filename=prometheus.yml
level=info ts=2020-06-28T16:08:33.524Z caller=main.go:827 msg="Completed loading of configuration file" filename=prometheus.yml
level=info ts=2020-06-28T16:08:33.524Z caller=main.go:646 msg="Server is ready to receive web requests."
4、后台启动:
$ cd /usr/local/prometheus/ && nohup ./prometheus &
5、使用 systemd 管理 Prometheus 服务:
$ cat << EOF > /usr/lib/systemd/system/prometheus.service
[Unit]
Description=Prometheus Server
Documentation=https://prometheus.io/docs/introduction/overview/
After=network.target

[Service]
Restart=on-failure
WorkingDirectory=/usr/local/prometheus/
ExecStart=/usr/local/prometheus/prometheus \
		  --config.file=/usr/local/prometheus/prometheus.yml
ExecStop=pkill prometheus

[Install]
WantedBy=multi-user.target
EOF
6、重启 Prometheus 服务:
$ systemctl daemon-reload
$ systemctl restart prometheus.service
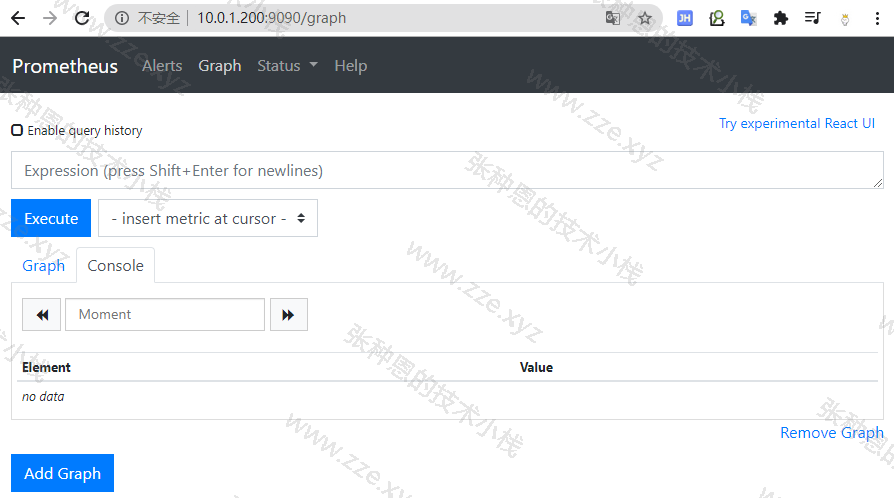
7、使用浏览器访问 Prometheus 服务所在主机的 9090 端口,如下:
启动选项说明
prometheus --web.listen-address="0.0.0.0:9090" --web.read-timeout=5m --web.max-connections=10 --storage.tsdb.retention=15d --storage.tsdb.path="/data/" --query.max-concurrency=20 --query.timeout=2m

常用启动参数:
    --web.read-timeout=5m:请求连接的最大等待时间;
    --web.max-connections=512:最大连接数;
    --storage.tsdb.retention=15d:开始采集监控数据时后,数据会保存在内存和硬盘中,保留期限的设置很重要,太长的话,硬盘和内存都吃不消,太短的话,保存的历史数据有效,企业中设置 15 天为宜;
    --storage.tsdb.path="data/":存储数据的路径;
    # 下面这两项是对用户执行 prometheus 查询时后的优化设置,防止太多的用户同时查询,也防止单个用户执行过大的查询而一直不退出
    --query.timeout=2m:查询超时时间;
    --query.max-concurrency:最大并发查询数;
配置文件
默认情况下 Prometheus 会使用其启动的二进制程序文件同目录下的 prometheus.yml 作为配置文件,在我们这里也就是 /usr/local/prometheus/prometheus.yml。
$ cat /usr/local/prometheus/prometheus.yml
# 全局配置
global:
  scrape_interval:     15s # 采集时间间隔,默认为 1 分钟
  evaluation_interval: 15s # 监控数据规则的评估频率,默认为 1 分钟,例:当我们设置了【内存使用量 > 70%】时发出报警这么一条 rule,那么 prometheus 会每 15 秒来执行一次这个 rule,检查内存情况是否满足这个 rule 的条件了
  # 数据采集超时时间,默认为 10 秒
  scrape_timeout: 10s

# Alertmanager 配置
# Alertmanager 是 prometheus 的一个用于管理和发出报警的插件,后面报警功能我们使用 Grafana 提供的,此部分可先忽略
alerting:
  alertmanagers:
  - static_configs:
    - targets:
      # - alertmanager:9093

# 规则文件定义,可使用通配符,一次加载规则并根据全局 evaluation_interval 配置定期评估它们
rule_files:
  # - "first_rules.yml"
  # - "second_rules.yml"

# 采集节点的配置,最起码包含一个 endpoint
scrape_configs:
    # 定义任务名称,自动附加为 label
  - job_name: 'prometheus'
    # 从目标获取 metrics 访问路径,默认为 /metrics
    metrics_path: '/metrics'
    # 请求的协议,默认为 http
    scheme: 'http'
    # 目标采集节点配置
    static_configs:
    - targets: ['localhost:9090','10.0.1.51:9100']
expoter 使用
下面我是在 10.0.1.51 机器上进行的。
仅搭建好 Prometheus Server 是不够的,我们需要在被监控的节点上安装一个 exporter 用来采集数据,这里我们就选用最常用的 node_exporter 这个插件。
node_exporter 是一个以 http_server 方式运行在后台,并且持续不断采集 Linux 系统中各种操作系统本身相关的监控参数的程序,其采集量是很大很全的,往往默认的采集项目就远远超过你的实际需求。
下面来进行安装操作:
# 解压
$ tar xf node_exporter-1.0.1.linux-amd64.tar.gz -C /usr/local/
# 创建软链接
$ ln -s node_exporter-1.0.1.linux-amd64 node_exporter
# 添加到环境变量
$ echo 'export PATH=$PATH:/usr/local/node_exporter/' > /etc/profile.d/node_exporter.sh
# 加载
$ . /etc/profile.d/node_exporter.sh
启动:
$ nohup /usr/local/node_exporter/node_exporter &
# 检查 9100 端口
$ ss -tanl | grep :9100
LISTEN     0      128       [::]:9100                  [::]:*
此时可以通过 HTTP 协议访问 9100 端口获取到采集到的 metrics 信息:
$ curl -s 10.0.1.51:9100/metrics | head -5
# HELP go_gc_duration_seconds A summary of the pause duration of garbage collection cycles.
# TYPE go_gc_duration_seconds summary
go_gc_duration_seconds{quantile="0"} 5.577e-06
go_gc_duration_seconds{quantile="0.25"} 6.437e-06
go_gc_duration_seconds{quantile="0.5"} 7.464e-06
随便选择一个键,在 Prometheus 的 Web 页下输入然后回车,就可以看到对应的监控视图 :
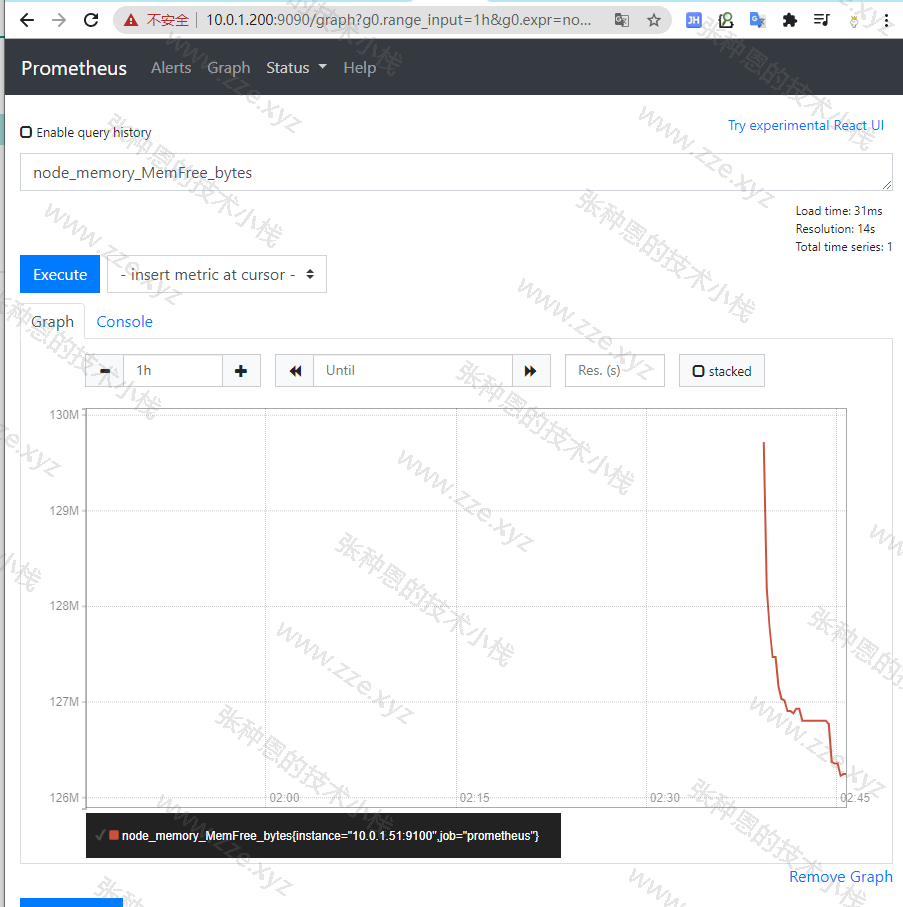
注意:在前文中我已经将 10.0.1.51 节点加入 Prometheus 的
scrape_configs配置了,如果没有加入是看不到这个监控视图的。
pushgateway
部署
pushgateway 可以在任意一台节点上安装,下面我就在 10.0.1.200 这个节点安装,在生产也的确推荐将 pushgateway 和 prometheus 服务状态同一台主机上。
下面来进行安装操作:
# 解压
$ tar xf pushgateway-1.2.0.linux-amd64.tar.gz -C /usr/local/
# 创建软链接
$ cd /usr/local/ && ln -s pushgateway-1.2.0.linux-amd64 pushgateway
# 添加到环境变量
$ echo 'export PATH=$PATH:/usr/local/pushgateway/' > /etc/profile.d/pushgateway.sh
# 加载
$ . /etc/profile.d/pushgateway.sh
启动:
$ nohup /usr/local/pushgateway/pushgateway &
# 检查 9091 端口
$ ss -tanlp | grep 9091
LISTEN     0      128       [::]:9091                  [::]:*                   users:(("pushgateway",pid=15019,fd=3))
修改 Prometheus 服务的配置文件,添加一个 job,targets 指向 pushgateway 服务的地址:
$ vim /usr/local/prometheus/prometheus.yml
scrape_configs:
...
  - job_name: 'pushgateway'
    static_configs:
    - targets: ['localhost:9091']
重启 Prometheus 服务:
$ systemctl restart prometheus.service
抓取脚本
pushgateway 本身是没有任何抓取监控数据的功能,它只是被动的等待推送过来。
下面来学习一波 pushgateway 编程脚本的写法,如下是使用 shell 编写的用于抓取 TCP WAIT 连接的瞬时数量的脚本。
$ cat /scripts/pushgateway/wait_connections_fetcher.sh
#!/bin/bash
# 本地机器名变量
instance_name=$(hostname -f | cut -d'.' -f1)
# 要求机器名不能是 localhost
if [ $instance_name == "localhost" ];then
    echo "Must FQDN hostname"
    exit 1
fi
# 定义一个 key
label="count_netstat_wait_connections"
# 获取 wait 连接的数量
count_netstat_wait_connections=$(netstat -an | grep -i wait | wc -l)

echo "${label}:${count_netstat_wait_connections}"

echo "${label} ${count_netstat_wait_connections}" | curl --data-binary @- http://10.0.1.200:9091/metrics/job/pushgateway/instance/${instance_name}
其实最终只是需要组装如下格式请求即可:
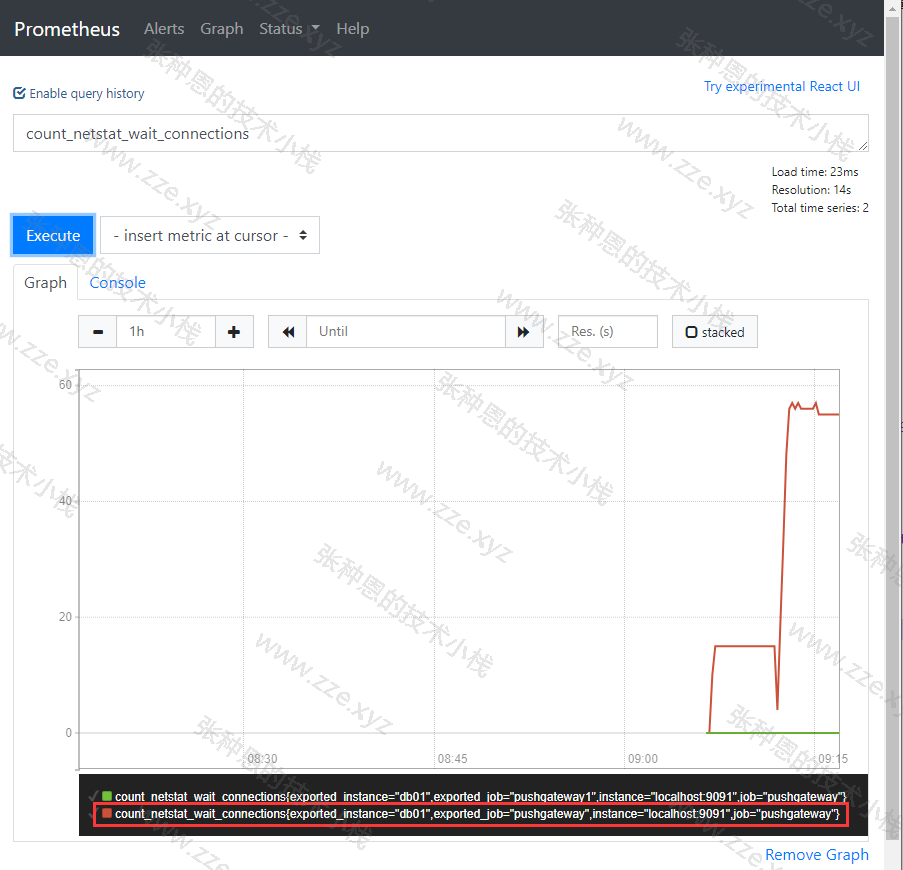
$ echo 'count_netstat_wait_connections 15' | curl --data-binary @- http://10.0.1.200:9091/metrics/job/pushgateway/instance/db01
循环执行该脚本,最终 Prometheus 的 Web 页面视图如下:
常用脚本和 PromQL
脚本
丢包和延时检测脚本:
$ cat /scripts/pushgateway/ping_fetch.sh
#!/bin/bash
instance_name=$(hostname)
lostpk=$(timeout 5 ping -q -A -s 500 -W 1000 -c 100 10.0.1.200 | grep transmitted | awk '{print $6}')
rrt=$(timeout 5 ping -q -A -s 500 -W 1000 -c 100 10.0.1.200 | grep transmitted | awk '{print $10}')

# -s 一个 ping 包的大小
# -W 延迟
# -c 发送多少个数据包

value_lostpk=$(echo ${lostpk} | sed 's/%//g')
value_rrt=$(echo ${rrt} | sed 's/ms//g')

echo "lostpk_${instance_name}_to_prometheus:${value_lostpk}"
echo "lostpk_${instance_name}_to_prometheus ${value_lostpk}" | curl --data-binary @- http://10.0.1.200:9091/metrics/job/pushgateway/instance/${instance_name}

echo "rrt_${instance_name}_to_prometheus:${value_rrt}"
echo "rrt_${instance_name}_to_prometheus ${value_rrt}" | curl --data-binary @- http://10.0.1.200:9091/metrics/job/pushgateway/instance/${instance_name}
PromQL
1、CPU 每分钟的使用率(报警阈值建议设置为 98%):
# CPU 非空闲使用率
(1-((sum(increase(node_cpu_seconds_total{mode="idle"}[1m])) by (instance)) / (sum(increase(node_cpu_seconds_total[1m])) by (instance)))) * 100
# io 等待 CPU 使用率
sum(increase(node_cpu_seconds_total{mode="iowait"}[1m])) by (instance) / sum(increase(node_cpu_seconds_total[1m])) by (instance)
2、内存使用率:
(1-((node_memory_Buffers_bytes + node_memory_Cached_bytes + node_memory_MemFree_bytes) / node_memory_MemTotal_bytes)) * 100
3、文件系统容量使用率(建议了解 predict_linear() 函数):
# 使用率
(1 - (node_filesystem_free_bytes / node_filesystem_size_bytes))* 100
# 空闲容量小于 20%
(node_filesystem_free_bytes / node_filesystem_size_bytes) < 0.2
4、磁盘 IO:
# 每秒 IO 数据量,单位为 MB
((rate(node_disk_read_bytes_total[1m]) + rate(node_disk_written_bytes_total[1m]))/1024/1024) > 0
5、网络传输速率:
rate(node_network_transmit_bytes_total[1m])/1024/1024
6、文件描述符使用率:
(node_filefd_allocated / node_filefd_maximum) * 100
grafana
grafana 我这里装在 10.0.1.200 这台机器。
部署
下载并安装:
# 下载
$ wget https://repo.huaweicloud.com/grafana/7.0.4/grafana-7.0.4-1.x86_64.rpm
# 安装
$ yum localinstall grafana-7.0.4-1.x86_64.rpm -y
启动:
$ systemctl start grafana-server.service
# 检查 3000 端口是否被监听
$ ss -tanl | grep 3000
LISTEN     0      128       [::]:3000                  [::]:*
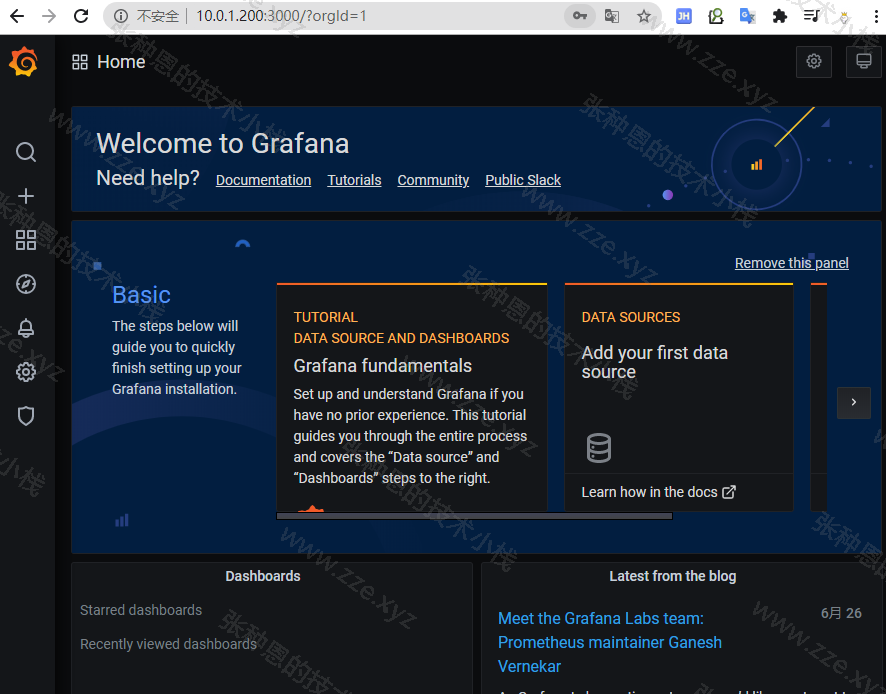
浏览器访问:

初始用户和密码都为 admin,登录成功后界面如下:
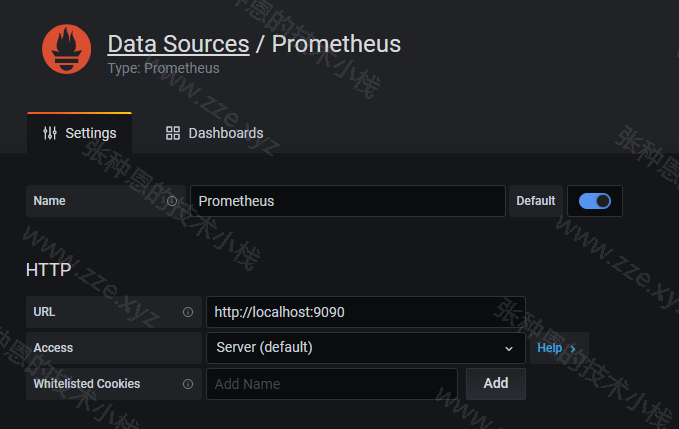
配置数据源

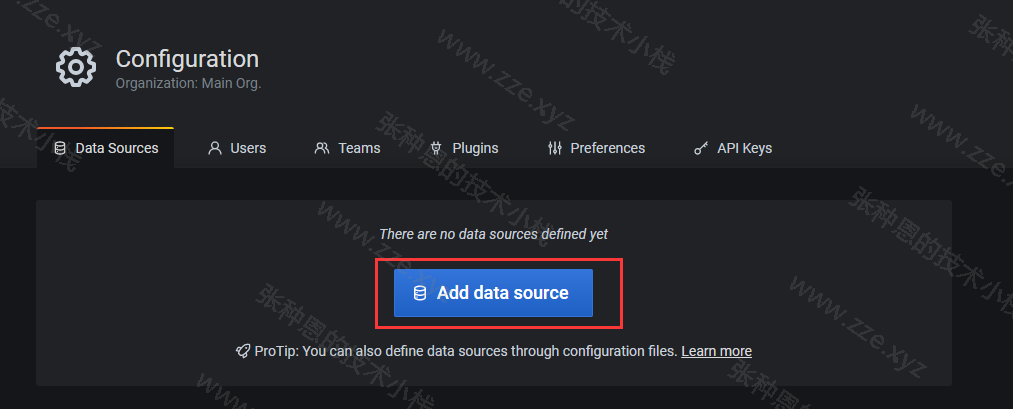
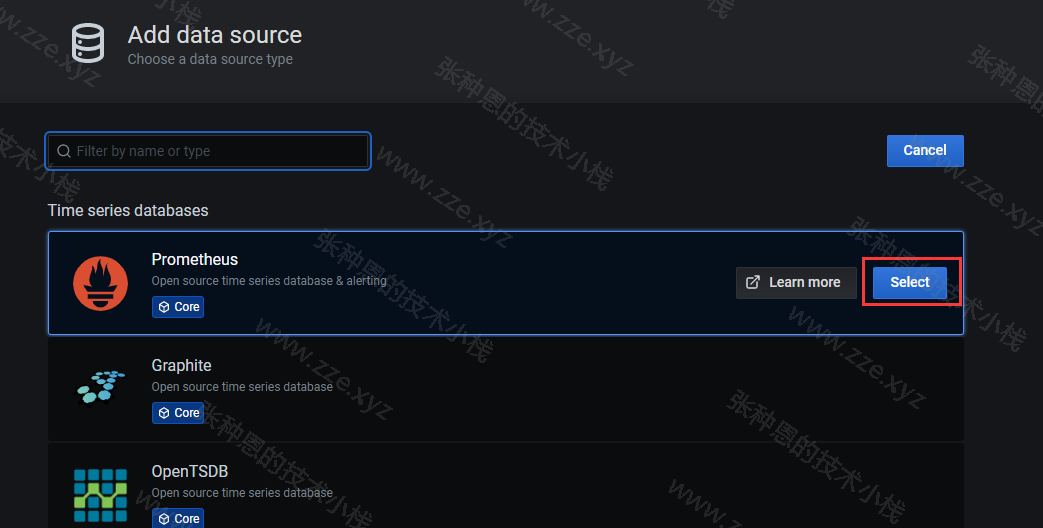
由于我这里 Grafana 和 Prometheus 安装在同一台机器,所以 Prometheus 服务的 URL 就直接指定为 http:localhost:9090:
创建 Dashboard
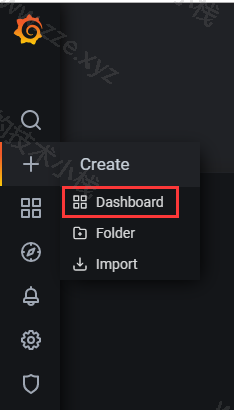
添加一个 pannel:
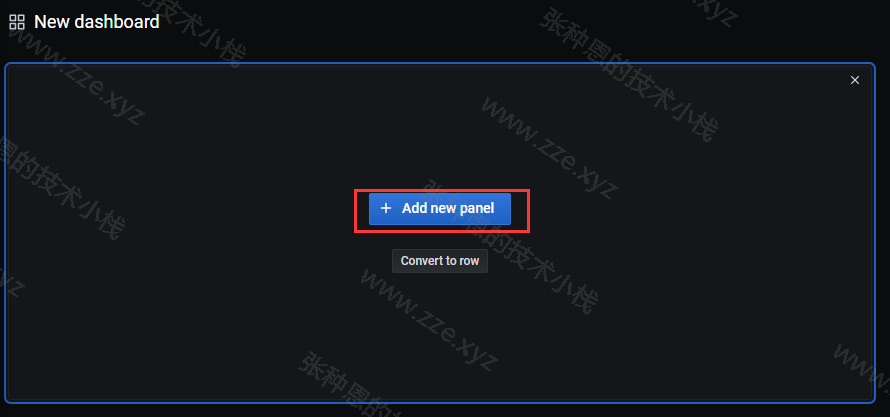
以创建一个 CPU 使用率折线图的 panel 为例:
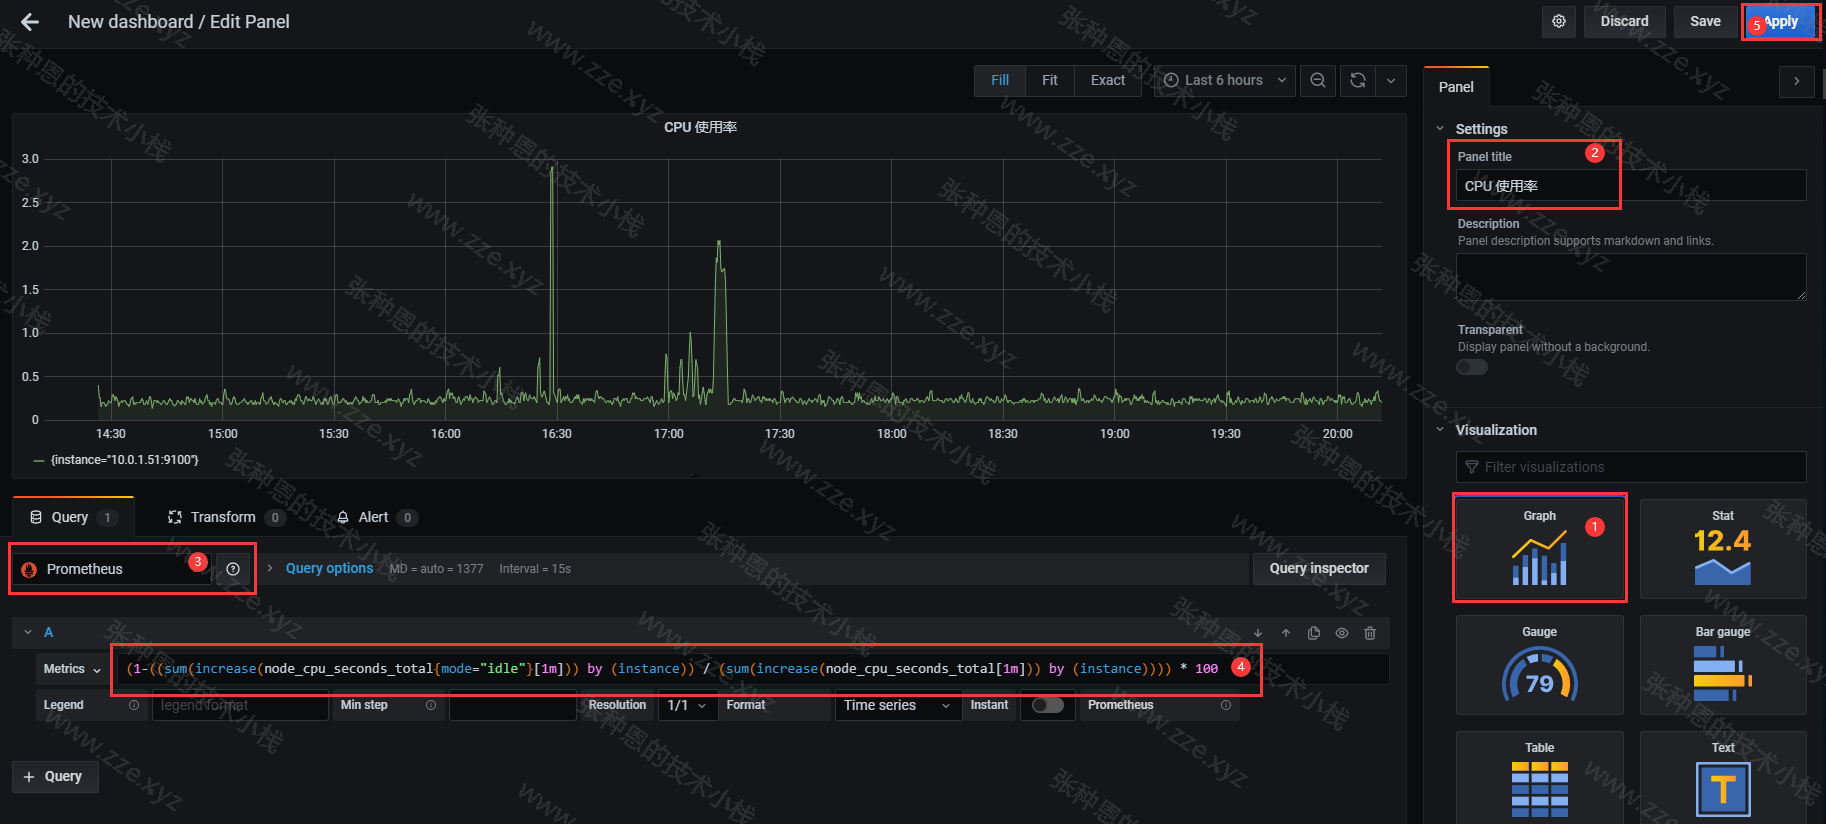
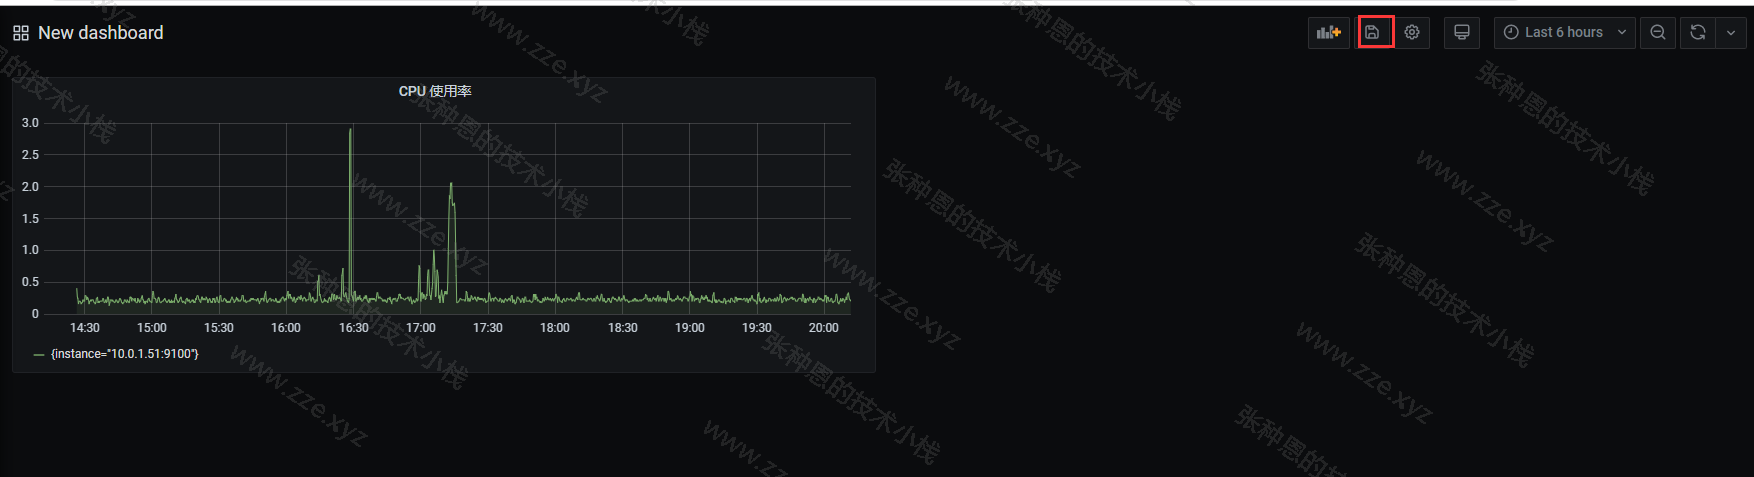
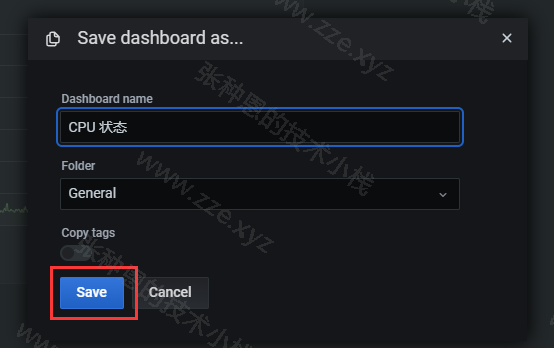
panel 创建成功,保存 Dashboard:
更多功能自己试着点吧点吧吧~~~挺简单的~
评论区